![]()
Trends in adult obesity
 This section introduces some demographic and epidemiological data. You will see how obesity has increased dramatically over time, and how it affects different sections of society (by class, gender and ethic group) in different ways.
Click on each title to see more information.
Social Class & Gender
The social determinants of obesity are illustrated well with these graphs from the Health Survey for England showing the progress of the obesity epidemic by social class with people from lower socio-economic groups having higher prevalence of obesity.
But what causes these discrepancies?
Health Survey for England 1994-2009 (5 year moving average)
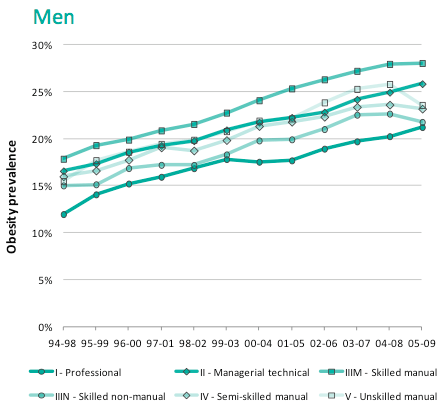
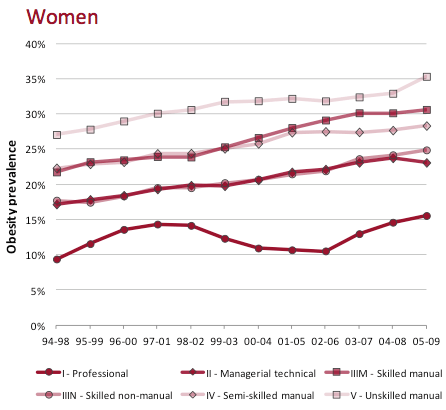
Adult (aged 16+) obesity: BMI ≥ 30kg/m2
The trend in obesity prevalence by social class differs by sex. For all social classes prevalence of obesity among men has increased between 1994 and 2009; men from the skilled manual class consistently have the highest obesity prevalence and professional men the lowest prevalence.
Women from the professional social class have the lowest prevalence of obesity. The apparent dip in prevalence in this group between 2001 and 2006 could be explained by the small sample size of women in this group during that period. There appear to be larger differences in prevalence in women between social class groups compared to men. Women in the unskilled manual class consistently have the highest prevalence of obesity.
The analysis for this chart was produced using Health Survey for England data from the UK Data Archive .
Ethnicity & Gender
The chart shows variation in prevalence of obesity by ethnic group and between sexes within ethnic groups.
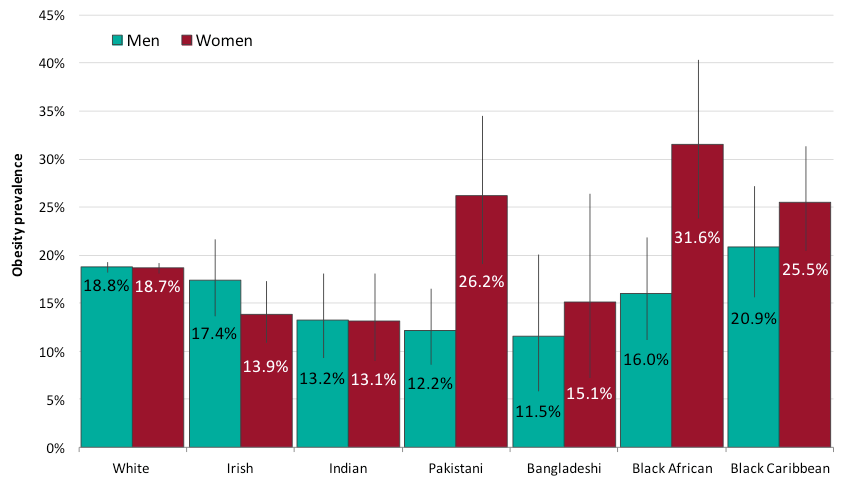
The chart shows 95% confidence intervals Adult (aged 16+) obesity: BMI ≥ 30kg/m2 Obesity prevalence is age standardised
Prevalence of obesity is higher in women compared to men for Black African and Pakistani ethnic groups. Prevalence of obesity is higher among women of Black Caribbean, Black African, and Pakistani ethnicities, compared to the other ethnic groups.
The analysis for this chart was produced using Health Survey for England data from the UK Data Archive .