Gated Equilibrium Radionuclide Ventriculography
- Overview
- Examples
- Parametric images
- Problems
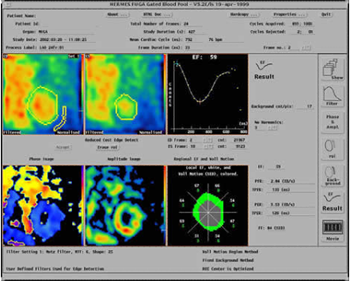
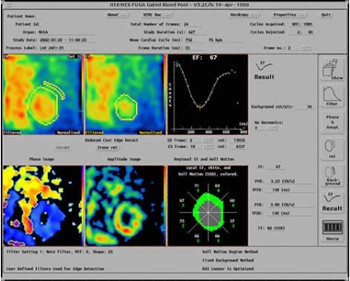
Estimation of LV-ejection fraction (LVEF) principle:
As the tracer is uniformly distributed in blood at equilibrium and as the concentration of the activity remains constant, the activity is directly proportional to volume.
Therefore, this technique does not rely upon geometric assumptions about LV shape (unlike echo and MRI, which do) and can accurately measure LVEF.
- A region of interest (ROI) is generated using automated as well as manual methods which identify the edge of the blood pool (endocardium)
- End-diastolic (ED) and end-systolic (ES) frames are identified
- Background is selected and and the counts are subtracted
- EF = (ED minus ES) divided by ED (expressed as a percentage)
This is an accurate and reproducible way of assessing left ventricular function:
- Left ventricular (LV) ejection fraction
- Regional wall motion
Indications:
- Prognosis after myocardial infarction (MI)
- Risk stratification before surgery
- Cardio-toxicity predictor and follow-up
- Detection of ventricular aneurysms
- Miscellaneous: estimation of regurgitant-fraction
 The image represents the blood pool in the left ventricle in an end-diastolic frame
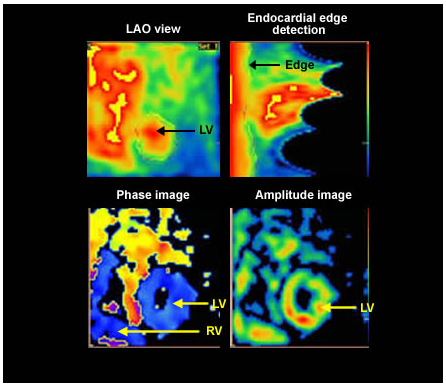 This is end-systolic frame
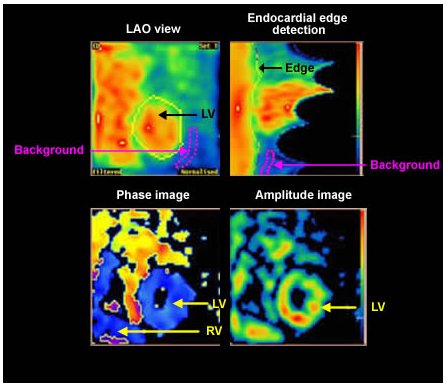 This shows the ROI for background correction
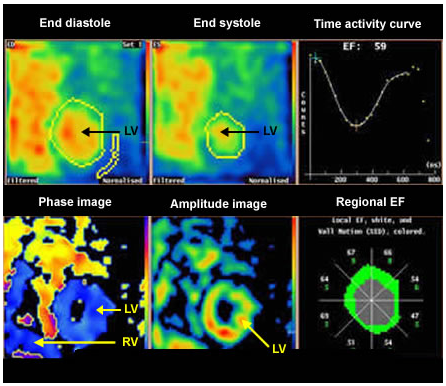 Ejection fraction result together with time activity
curve
Ejection fraction result together with time activity
curveParametric images are obtained from Fourier analysis which provides both phase images and amplitude images.
Phase images show the timing of peak contraction. It is expressed in degrees over the R-R interval (0–360). The images are colour coded.
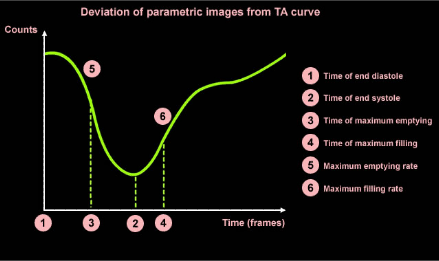 Shows the time activity curve from which the parametric
images are derived . [Phase Image]
Shows the time activity curve from which the parametric
images are derived . [Phase Image]
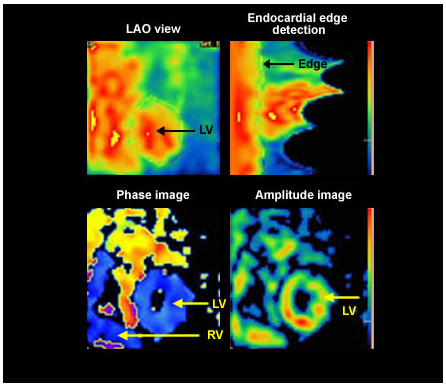
 The thin arrow points to a normal phase image. Both the ventricle and the atria are coded in the same colours as they work in synchrony. The thick arrow points to an image showing left bundle branch block (LBBB) pattern. Note the ventricles are now colour coded differently. [Amplitude Image]
 In a patient with bundle branch block (BBB), the ventricles are activated at different times (there is a delay in activation of the ventricle with BBB). This time difference in activation is represented on the phase images by different colour coding. The phase image represents a right bundle branch block (RBBB)
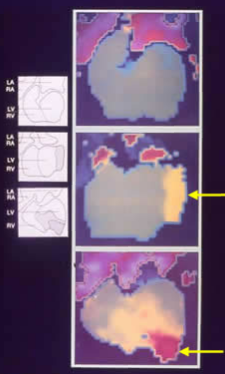 This shows examples of ventricular aneurysms (phase images). The aneurysmal areas (arrows) are out of phase
The problem encountered whilst acquiring gated studies are:
- Poor definition of blood pool edges
- Poor separation of left and right ventricles
- Poor gating
- Significant soft tissue attenuation
- Poor background subtraction
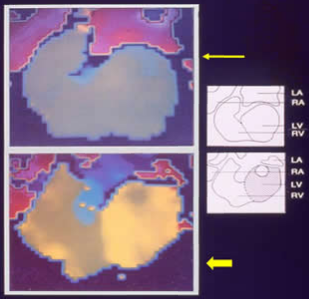
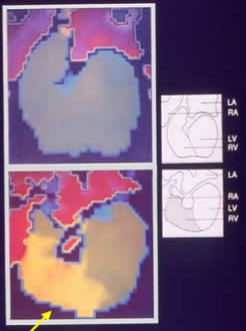
Image left: Ejection fraction result together with phase and amplitude images
Image right: Change in result with different background correction