
Henry Smith
83, Male
Click on the tabs below to view the results and interpretation of some of the investigations.
12 lead ECG
Result:
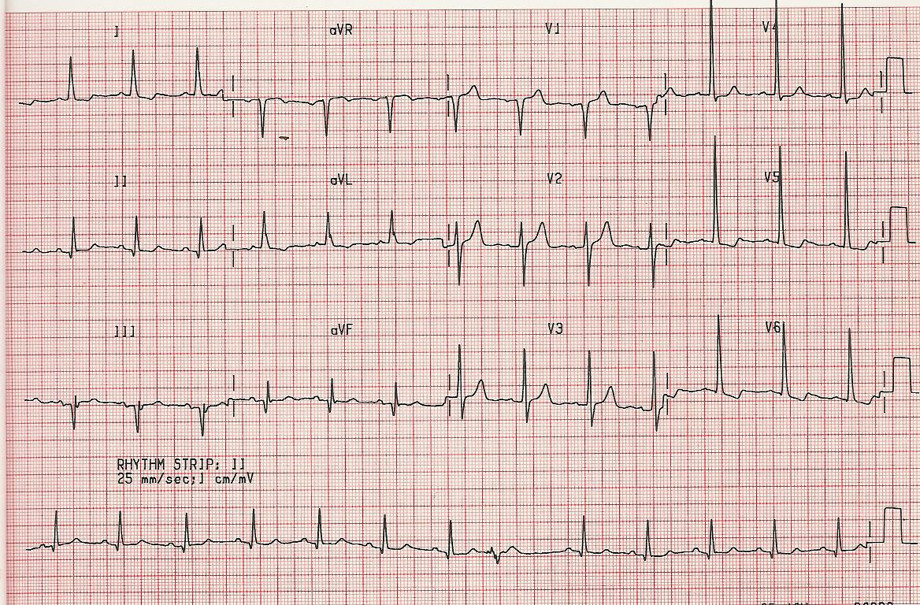
This ECG shows sinus rhythm, normal axis and a heart rate of ~75 bpm. Your tutor will demonstrate how to ascertain heart rate from an ECG. The P wave and PR interval are normal. QRS duration is normal. However, there are voltage criteria for LVH and abnormal downsloping ST segments associated with LV strain.
Explanation
When aortic stenosis develops there is an increase in left ventricular systolic pressure. This induces compensatory cardiomyocyte hypertrophy via complex signalling cascades that results in increased left ventricular wall thickness.
Left ventricular hypertrophy (LVH) can be diagnosed on ECG. The increased LV muscle mass results in larger amplitude QRS complexes (ventricular depolarization) and abnormal repolarization (so called ‘strain’ pattern of ST and T wave abnormalities). These findings are often most marked in the lateral chest leads (V3-6). Beware that LVH with strain can mimic myocardial ischaemia, at least on an ECG, and are best differentiated with a careful history and examination.
Several people have defined ECG criteria for LVH with strain, but the most commonly used are the Sokolow-Lyon Criteria. Here, the S wave amplitude in V1 is added to the R wave in V5 or V6. If the sum is >35 mm, LVH is present.
Remember, voltage criteria for LVH do not constitute a formal diagnosis, which is made by imaging. Do not be mislead by young, think patients who may meet these criteria.
NT-pro BNP (Clinical Biochemistry)
Result:
19,562 pg/ml
Explanation
Brain natriuretic peptide (BNP) or NT-proBNP is a biomarker for diagnosis and prognostication in conditions associated with myocardial wall stress, including aortic stenosis. In such conditions, activation of the BNP gene in cardiomyocytes results in the production of an intracellular precursor called proBNP-108. This is cleaved to generate the biologically inactive NT-proBNP and the biologically active BNP. BNP stimulates natriuresis and vasorelaxation via inhibition of renin, aldosterone and sympathetic nervous activity, in an attempt to correct increased myocardial wall stress.
NT-proBNP levels are known to correlate with ventricular wall stress and severity of HF (Abraham WT et al. N Engl J Med 2002;347:161–167). Likewise, NT-proBNP is elevated in aortic stenosis and has been associated with increased all-cause 3-year mortality in patients with severe aortic stenosis (Auensen et al. PLOS One 2017; https://doi.org/10.1371/journal.pone.0179304)
Adapted from: http://circ.ahajournals.org/content/123/18/2015
Chest X-ray
Result:
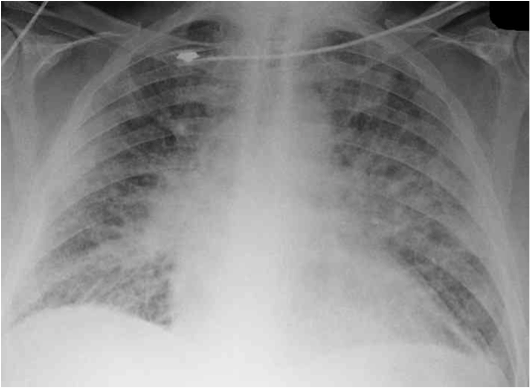
The chest X-ray is useful to document the examination findings of pulmonary oedema. In addition, there may be evidence of another cause of breathlessness such as COPD or interstitial lung disease. This CXR demonstrates pulmonary venous congestion with upper lobe diversion. This is typical of pulmonary oedema.
Explanation
Although left ventricular hypertrophy is a physiological, compensatory response to preserve cardiac output, it results in reduced diastolic compliance. Eventually, LV end-diastolic pressure (LVEDP) rises, which causes a corresponding increase in pulmonary arterial pressure. While patients with severe aortic stenosis typically have preserved LV systolic function and cardiac output for many years, cardiac output often fails to rise during exercise, resulting in exertional symptoms of the type described by Mr Smith. Furthermore, diastolic dysfunction and raised pulmonary arterial pressure results in pulmonary oedema, like in this CXR.
Eventually, severe aortic stenosis results in LV systolic dysfunction. Consequent activation of the renin-angiotensin-aldosterone system compounds the fluid overload and results in an overt heart failure syndrome.
Echocardiogram
Result:
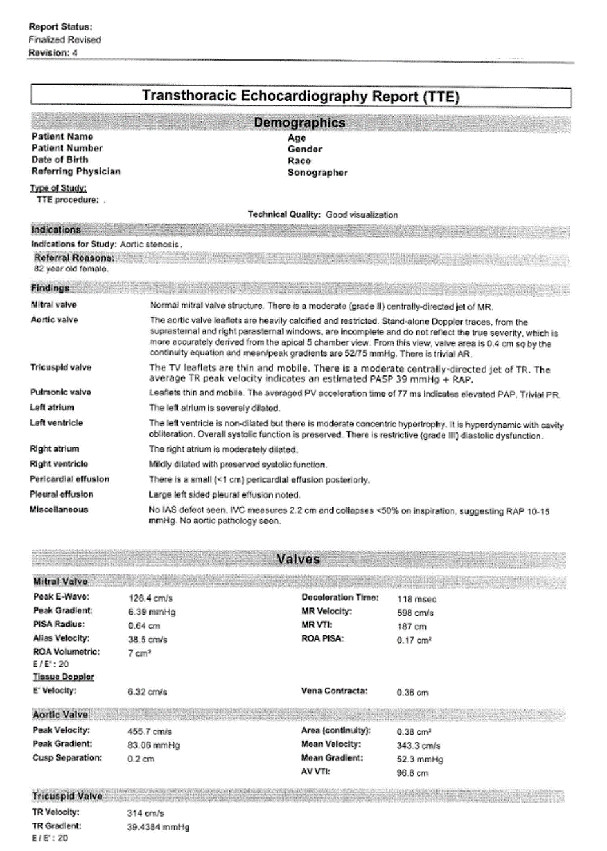
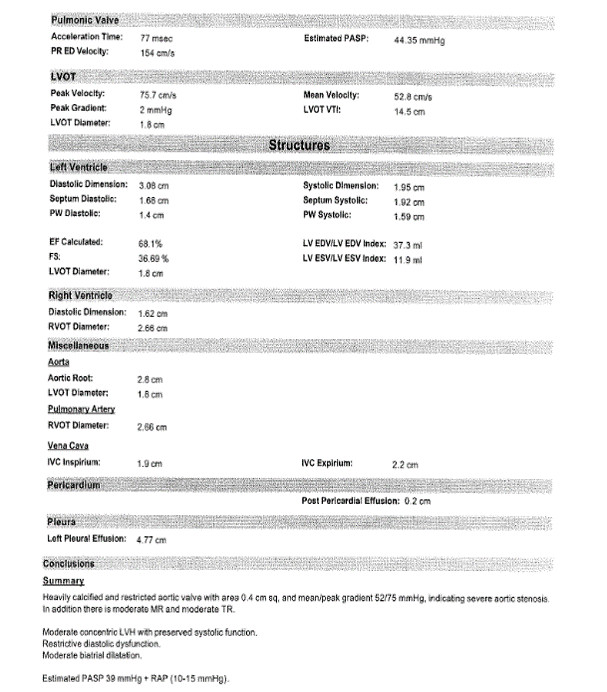
Please see the formal Echo report (below), and videos. This demonstrated a heavily calcified and restricted aortic valve with area 0.4 cm2 and mean/peak gradients 52/75 mmHg, indicating severe aortic stenosis.
Echocardiogram video
Explanation
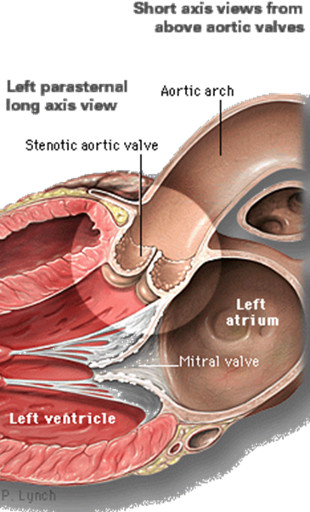
Echocardiography measures the anatomical structures of the heart and how they move in the cardiac cycle. It can be used to measure the fraction of blood ejected during systole, the effective cross-sectional area of the aortic valve and the pressure gradient across the valve (the higher this number, the bigger the drop in pressure between the left ventricle and aorta, and the more severe the aortic stenosis).
All of these parameters have normal ranges, which are easily accessible online if you’re interested, and these help grade the severity of aortic stenosis. In this case, the parameters point to severe disease.
Revision of aortic valve anatomy
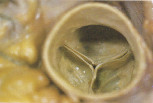
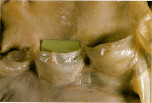
The aortic valve has 3 equally sized cusps, separated by commisures and supported by a fibrous annulus. The cusp-free edges form a slight thickening at the mid-point; this is known as the Arantius nodule. There is a Valsalva sinus behind each cusp, which shares a name with the cusp (right, left and non-coronary cusps). At the superior margin of the sinuses is the sinotubular junction.
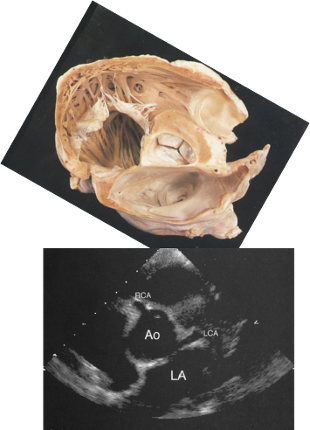
B) An echocardiography short axis view showing the aortic sinuses and associated coronary artery origins.
In ‘short axis’ (an echocardiography description of a cross-section), all three cusps are visible. This makes the ‘Mercedes Benz’ sign, seen in the above pathological image (Fig 5 and associated videos with normal and abnormal examples).
Normal PSAX (Mercedes Benz sign) video
Normal PSAX (Mercedes Benz sign) video, with colour
From top, going clockwise, these are the right-, left- and non-coronary cusps (the latter so called because there is no associated coronary artery).
Aortic stenosis video
Aortic stenosis PSAX video, with colour
Coronary angiogram
Result:
Invasive coronary angiography demonstrated normal coronary arteries (see video).
Left Anterior Descending ( LAD )
Right Coronary Artery ( RCA )
Explanation
In a patient with breathlessness and chest tightness, it is important to exclude ischaemic heart disease as a cause. While the examination and investigations to date point to a diagnosis of aortic stenosis, it is nonetheless important to exclude coronary artery disease.
Furthermore, aortic valve surgery may be a treatment option in this patient and it is therefore necessary to exclude concomitant coronary artery disease (that could be fixed simultaneously with coronary artery bypass grafting). While non-invasive assessment (CT coronary angiogram, for example) is an option, his age and risk factors make invasive angiography a more appropriate test.