
Katie Tang
32, Female
Click on the tabs below (and click headings to open and close the subpanels) to view the results and interpretation of the investigations.
12 lead ECG
Rationale:
A 12-lead ECG is very important investigation and can help exclude acute myocardial infarction and point to other potential diagnoses.
Result & Explanation
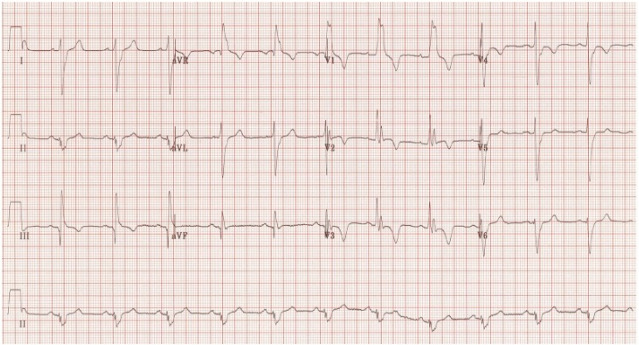
The most common ECG pattern in patients diagnosed PE is sinus tachycardia. However, patient can also develop atrial fibrillation. The S1Q3T3 pattern is diagnostic and present in 15-25% of patients subsequently diagnosed with PE. This refers to a large S wave in lead I, a large Q wave in lead III and T wave inversion in lead III. Importantly a RBBB pattern indicates right heart strain suggesting elevated right ventricular pressures secondary to obstruction by a PE in the pulmonary vasculature.
Echocardiogram
Result:
Explanation
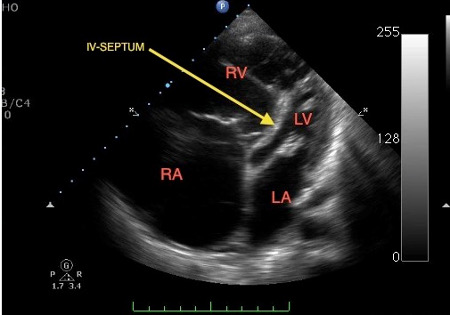
The echo cardiogram shows signs of acute right heart failure. Due to the pressure load on the right heart (Right atrium (RA) and right ventricle (RV) become dilated) seen in the above picture on the left. This is in comparison to the compressed left ventricle (LV) and left atrium (LA) seen in the picture above on the right.
Bubble study Echo
Result:
Explanation
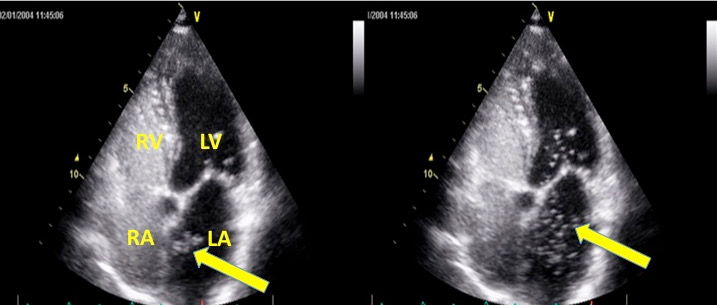
Contrast echocardiography demonstrating contrast medium (agitated saline) passing from the right atrium to left atrium instantly following injection (left, arrow). Bubbles can be seen in left atrium and entering the left ventricle (right, arrow). If bubbles pass from right to left on coughing or performing valsalve manoeuvre this confirms a PFO.
Arterial blood gas
Explanation:
This is important to determine the circulating oxygen levels. This is normally performed via the radial artery. It is important to document the inspiratory oxygen concentration the patient is receiving.
Results
| Investigation Name | Investigation Result | Normal Range | Units |
|---|---|---|---|
| PaO2 (on air) | 7.2 | 11.0 - 13.5 | kPa |
| PaCO2 | 3.8 | 4.8 - 5.6 | kPa |
| pH | 7.33 | 7.35 - 7.45 | |
| [H+] | 49 | 35 - 45 | nmol/L |
There is ventilation-perfusion mismatch in PE, therefore the patient develops hypoxaemia. If there is a reduced cardiac output as seen in a massive PE, the patient developes a metabolic acidosis due to anaerobic respiration and respiratory compensation. This leads to hyperventilation and the patient “blowing off” C02 in the early stages. In such cases the widening of the alveoloarterial PO2 gradient (>20 mm Hg) may be more sensitive than PaO2 alone. Both hypoxaemia and a wide alveoloarterial PO2 may obviously be due to many other causes. Blood gases, therefore, may heighten the suspicion of pulmonary embolism and contribute to the clinical assessment, but they are of insufficient discriminant value to permit proof or exclusion of pulmonary embolism.
Troponin
Explanation:
In acute PE, the mechanic load of the right ventricle is increased because of the increased pulmonary vascular resistance following pulmonary artery obstruction. That can lead to acute right ventricular dilatation. The dilatation and hypokinesia of the right ventricle may cause severe myocardial ischemia and increase the serum troponin level. Elevated troponin levels support the diagnosis of acute massive PE.
Results
| Investigation Name | Investigation Result | Normal Range | Units |
|---|---|---|---|
| Troponin T | < 13 | ng/L |
D-dimer
Explanation:
A d-dimer has a low specificity and can be elevated in trauma, surgery and infection. However a negative d-dimer has a high negative predictive value and can be used in low risk patients to rule out a PE or DVT. If levels are elevated above 2000ng/mL there is a 7-fold increase risk of severe PE.
Results
| Investigation Name | Investigation Result | Normal Range | Units |
|---|---|---|---|
| D-Dimer | 5300 | <200 | ng/mL |
Coagulation and Clotting
Investigation title:
- Lupus anticoagulant
- Deficiency of antithrombin, protein C or S.
- Resistance to activated protein C (factor V Leiden).
- Prothrombin gene mutation (G20210A polymorphism).
- Raised plasminogen-activator inhibitor, plasminogen disorders.
- Hyperhomocysteinaemia.
- High plasma concentration of factor VIII.
Results & Explanation
These are specialist tests that are performed to determine the diagnosis if no clear cause for venous thromboembolism is identified. If these tests are positive the patient may require further treatment and Haematology follow up.
Chest X-ray
Rationale:
The CXR is an immediate test that can be performed in the emergency department and should be performed in anyone with chest pain and/or shortness of breath.
Results & Explanation
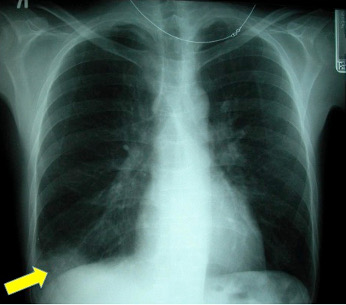
A chest x-ray is neither sensitive nor specific for a pulmonary embolism. It is used to assess for differential diagnostic possibilities such as pneumonia and pneumothorax rather than for the direct diagnosis of PE.
Described chest radiographic signs include:
- Fleischner sign: enlarged pulmonary artery (20%)
- Hampton hump: peripheral wedge of airspace opacity and
s lung infarction (20%) - Westermark sign: regional oligaemia and highest positive predictive value (10%)
- Pleural effusion (35%)
CT pulmonary angiography
Result :
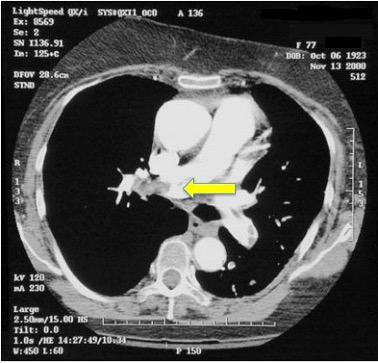
This image study with contrast shows clearly a large occlusive thrombus in the right main pulmonary artery.