First Pass Study
- Overview
- Data acquisition & technical nursing aspects
- Normal first pass study images
- Images of left to right shunts
Radiopharmaceutical
In carrying out a first pass study (left to right shunt), essentially any radiopharmaceutical except 99mTc MAA can be used.
Commonly 99mTc DTPA/MAG3 or 99mTc pertechnetate is used because:
- It is rapidly excreted via the kidney
- The study can be repeated after 1 hour if required
- It results in a low radiation dose - as low as reasonably practicable (ALARP) dose principle
- It can achieve a high specific activity in a small volume which is essential for optimum bolus injection
800MBq is the diagnostic reference level, dose in a volume of less than 1ml. The average adult dose is adjusted for children as per ARSAC Notes for Guidance.
A first pass study is a non-invasive, quantitative, simple, rapid and reliable investigation and can be repeated as required.
Clinical value of left to right shunt measurement
- Is an ASD large enough to justify closure?
- Haemodynamic significance of a ventricular septal defect (VSD), or a residual VSD
- Evidence that a VSD is closing spontaneously
The heart contains four valves:
Click on each title to see a description.
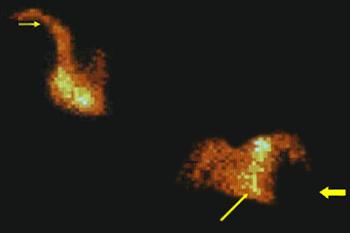
This is a normal first pass radionuclide angiogram. You can see the normal sequence of chamber filling. The tracer enters the right heart (long thin arrow) from the superior vena cava (thin short arrow). It then moves into the lungs. At this point one can see a negative left ventricle (thick arrow)
In these images you can see the tracer now enters the left ventricle (thick arrow) and the right ventricle is empty (thin arrow)
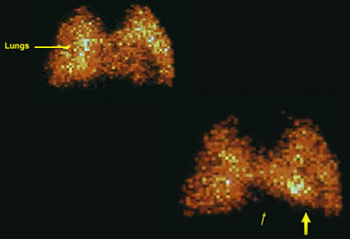
The tracer leaves the left ventricle via the aorta (arrow) into the systemic circulation. At this point, there is no tracer seen within the lungs
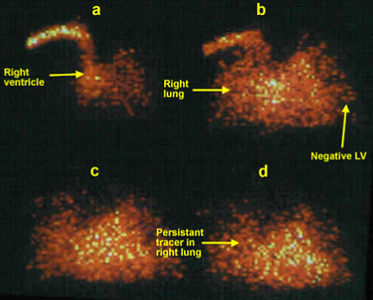
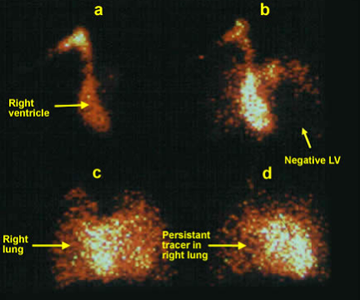
Here you see the tracer enters the right heart in image a. In images b, the tracer is seen in the lungs and a negative left ventricle. In image c and d, one would expect a negative right ventricle and a clear outline of the left ventricle. However, you see the tracer in the lungs persist (due to recirculation from the left) and the outline of the ventricles is not clear. There is significant recirculation (shunting) of tracer from the left to the right (across known ASD).
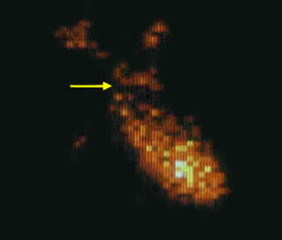
Here you see the tracer enters the right heart in image a. In image b, the negative enlarged left ventricular outline is seen (arrow). In images c and d you see the tracer in the lungs and the ventricles. One would expect a negative right ventricle and a clear outline of the left ventricle in image d. However, the outline of the ventricles is not clear as there is significant recirculation (shunting) of tracer from the left to the right (across known VSD).