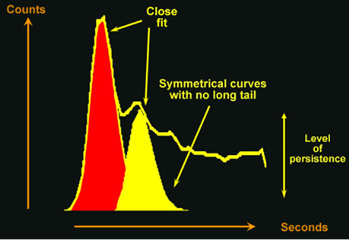
Image 1: Depicts the SVC region of interest
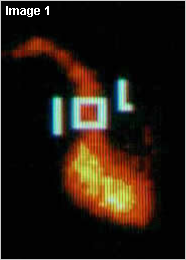
Image 2: Shows regions of interest over the lungs and the systemic circulation
In order to estimate the degree of shunting across the defects we use the area under the curve method (Maltz and Treves 1973).
Regions of interest (ROI)
For the analysis, various regions of interest are drawn and a time/activity curve is generated for these:
- Superior vena cava (SVC): to assess the bolus
- Pulmonary: to measure the left to right shunt
- Systemic: to exclude a right to left shunt
Click on the Time activity curve analysis tab above to continue.
Assessment of shunt severity is illustrated in the following images.
Click on each title to see a description.
Image 1
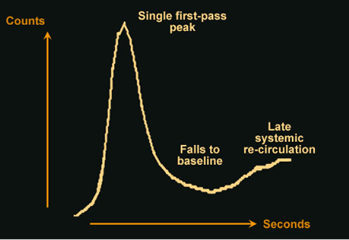
Normal pulmonary time-activity curve (TAC). As you can see, following injection of the tracer there is initially an increase in the number of counts in the ROI. As the tracer leaves the ROI, the count levels fall close to baseline. The late systemic recirculation indicates the second pass of the tracer through the heart.
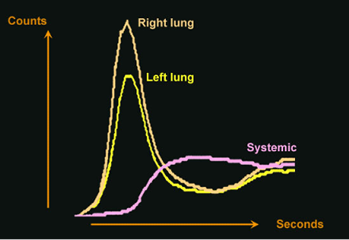
Image 2
Depicts the TAC curves for various regions of interest.
Image 3
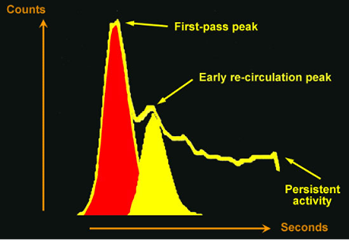
Pulmonary time-activity curve (left to right shunt). The area under the curve is calculated by using the best fit to the curve (Gamma variate fit). The red area represents the area under the first pass pulmonary TAC. This corresponds to the pulmonary blood flow. The yellow area represents the area under the recirculation pass (shunt from left to right) TAC.
Image 4
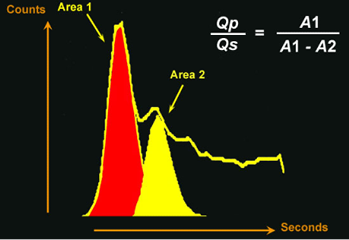
Pulmonary to systemic flow ratio. The shunt size is caclulated as a ratio of pulmonary blood/systemic blood flow. The systemic blood flow should be the same as the pulmonary blood flow in normal circumstances. However, in the presence of a left to right shunt, there is less blood reaching the systemic circulation as some of it is shunted back into pulmonary circulation across
the defect. This is calculated by subtracting Area 2 from Area 1. The shunt size is expressed as Qp/Qs ratio as indicated in the figure. This should be usually 1. In the presence of a left to right shunt this value increase >1
The various degrees of left to right shunts are below:
- Normal Qp/Qs is 1
- A measured Qp/Qs < 1.3 is within normal range
- Qp/Qs < 2 is a small left to right shunt
- Qp/Qs of 2 to 2.5 is a moderate shunt
- Qp/Qs > 2.5 is a large shunt
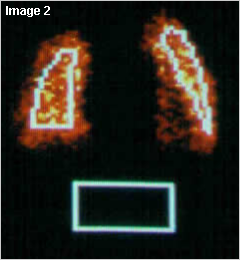
Image 5
This image illustrates the assessment of the best-fit to the curves. The area shown in red represents best-fit to the first pass curve through the lungs. The area in yellow shows the best-fit to the recirculation curve. There is also a high level of activity persisting within the lung field.
Click the Next button below to continue.