Concepts of Risk
Total Radiation Dose to the UK Population
- Total Radiation Dose 1
- Total Radiation Dose 2
The table and pie chart below describe the contributions to the total radiation dose received by the UK population from various natural and man-made sources:
| Source Type: | Source: | Contribution (%): |
|---|---|---|
| Natural(Total 85.5%) | Cosmic Rays | 10% |
| Gamma Rays | 14% | |
| Food and Drink | 11.5% | |
| Radon | 50% | |
| Artificial(Total 14.5%) | Medical | 14% |
| Fallout | 0.2% | |
| Miscellaneous | <0.1% | |
| Occupational | 0.3% | |
| Nuclear Discharges | <0.1% |
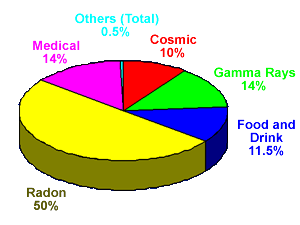
Contribution to total exposure of UK population
It is important to note:
- how relatively small the contribution of occupational exposure is to the average member of the population.
- how significant medical exposure is to the total exposure of the UK population.
Although the major contributions to the total exposure from natural sources cannot be reduced, radiation protection measures can significantly reduce the radiation doses received by patients undergoing medical exposures.
Conversely a positron may be created when the nucleus has too many protons to be stable and it is the changing of a proton into a neutron with the subsequent release of a positron particle that accounts for the genesis positrons.
Click on an option.
Which type of radiation is most easiest to shield?