Adam Smith
37, Male
Click on the tabs below to view the results and interpretation of some of the later investigations.
These are cardiac investigations and imaging.
Echocardiogram
Rationale:
Adam has a highly abnormal ECG and 2 murmurs on examination. In addition, he has been experiencing breathlessness and syncope, and has a slightly elevated troponin. Therefore an echocardiogram would certainly be warranted as the next investigation after the initial tests.
The purpose of the echo would be to assess Adam’s cardiac structure and function, looking in particularly at his left and right ventricular systolic function, any regional wall motion abnormalities to suggest ischaemia, and any evidence of structural heart disease. In addition, you would want to evaluate his valves given the murmur.
Results & Explanation
A transthoracic echocardiogram is performed, which reveals normal biventricular size and systolic function and no regional wall motion abnormalities. All 4 valves appear structurally normal and there are no features to suggest an atrial or ventricular septal defect. However, there are a number of findings which are illustrated in the videos and stills below:
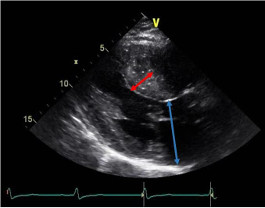
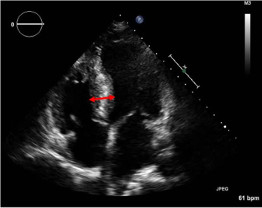
1. Asymmetric septal hypertrophy (red arrow) in parasternal long axis view (wall thickness is 20mm) and significant left atrial dilatation (50mm):
2. “M-mode” through the septum demostrates systolic anterior motion (SAM) of the anterior mitral valve leaflet (red arrow):
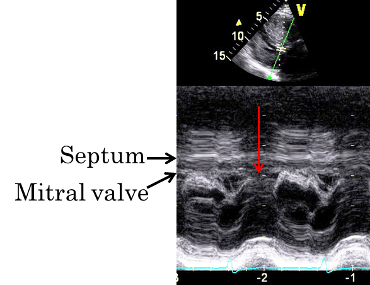
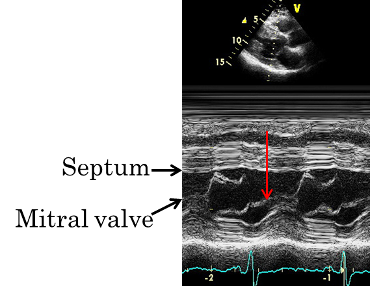
The red arrow shows the anterior mitral valve leaflet hitting the interventricular septum during systole, when it should actually be meeting the posterior mitral valve leaflet at this point in the cardiac cycle and closing the mitral valve orifice, as shown in Fig.22c (this is the normal appearance).
3. Asymmetric septal hypertrophy (red arrow) is also seen in apical 4 chamber view:
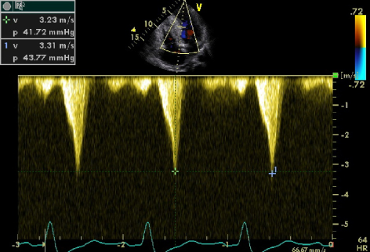
4. Pulse wave Doppler measurements across the left ventricular outflow tract demonstrate a resting gradient through the left ventricular outflow tract of around 43mmHg (normal should be <4mmHg):
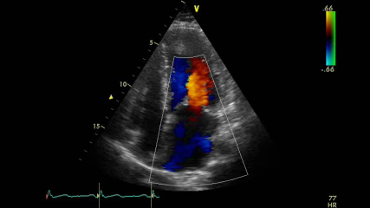
5. Colour flow Doppler measurements through the mitral valve demonstrate posteriorly directed mitral regurgitation (MR), typical of the MR seen with SAM:
24-hour Holter monitor
Rationale:
Adam has presented with palpitation and syncope. It is therefore important to take a look at what his heart rhythm is doing over a longer period of time than a simple ECG can provide. For this, a 24-hour Holter monitor is performed where Adam is attached to a portable heart monitor which continuously records his heart rhythm while he carries on his usual day-to-day activities. Adam is asked to keep a diary of any symptoms he experiences whilst he has the Holter monitor attached, so that symptom correlation with any potential arrhythmias can be obtained.
Results & Explanation
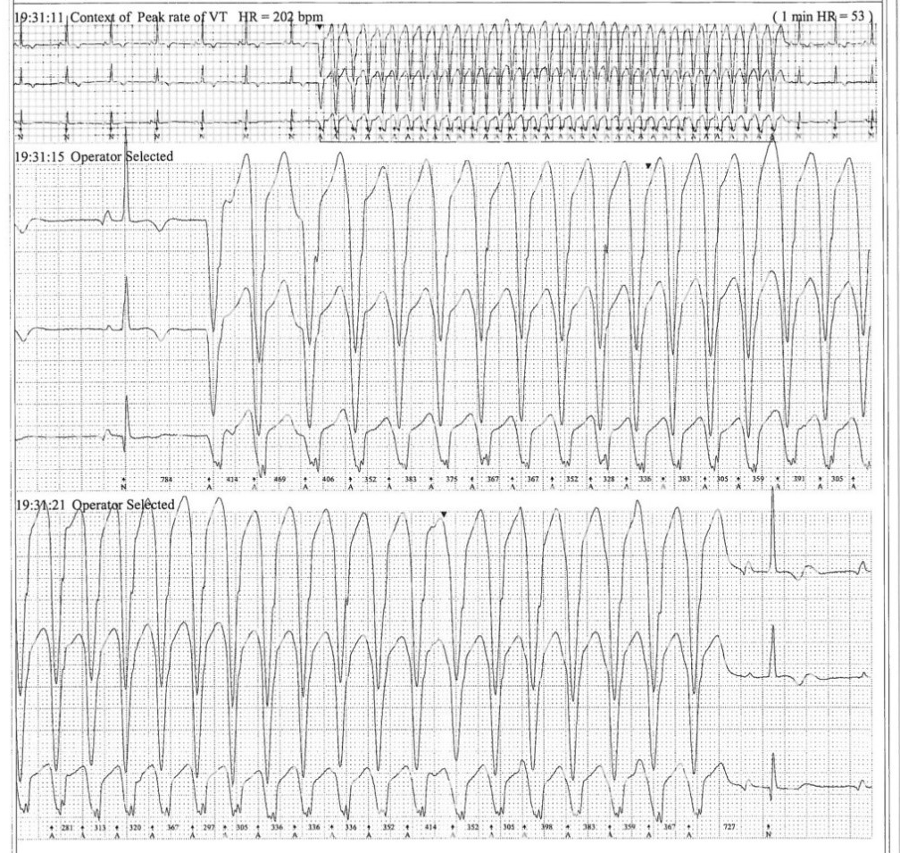
The 24-hour Holter monitor demonstrates 1 episode of a broad complex tachycardia high suggestive of non-sustained ventricular tachycardia (VT). Adam keeps a diary of his symptoms while he has the 24-hour Holter attached, and the episode of non-sustained VT corresponds to a time where he suddenly feels palpitation with momentary dizziness, which only lasts a few seconds and then subsides. This is similar to the symptoms he has been experiencing during exercise, although briefer.
Exercise tolerance test
Rationale:
Given that Adam has been experiencing symptoms on exercise, he is also put on the treadmill for an exercise tolerance test. This is to see what his blood pressure and heart rate response to exercise is like, but also to look for any ECG changes, symptoms and exercise-induced arrhythmias.
Results & Explanation
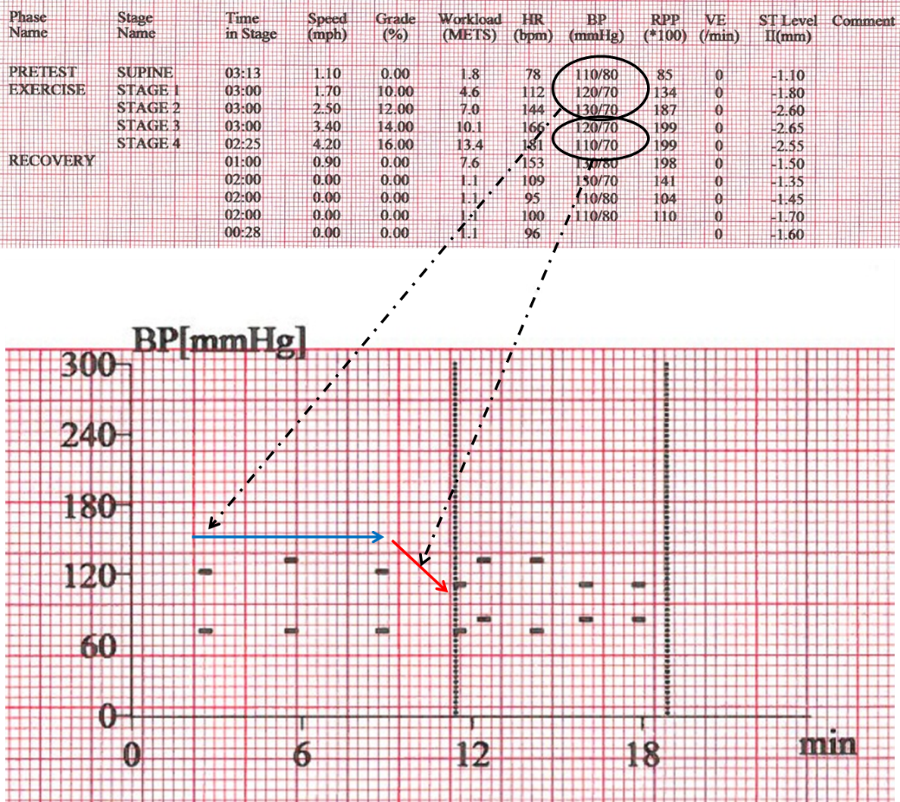
Adam does well on the exercise test, reaching stage 4 of the Bruce protocol. This is a standardised protocol for treadmill tests graded from stages 1 to 7, with each stage having a gradually increasing slope and speed of the treadmill. Stage 4 corresponds to an incline gradient of 16% and treadmill speed of 4.2 miles per hour (for more detail see https://en.wikipedia.org/wiki/Bruce_protocol).
Adam achieves 13.4 metabolic equivalents (METS) of work (one MET is defined as 1 kcal/kg/hour and is roughly equivalent to the energy cost of sitting quietly). He does not experience any symptoms and the test is stopped because his age-predicted target heart rate is reached (this is calculated by the simple formula: 220-patient’s age; for Adam, this will therefore be 220-37=183). It is noted before the test that he has resting ECG changes as described above, which do not really change on exercise, and there are no arrhythmias seen on exercise. However, it is noticed that his blood pressure fails to rise by 25mmHg during exercise which is the minimum rise deemed normal (i.e. he has a flat blood pressure response to exercise – blue arrow). In fact, his blood pressure falls slightly during the latter stages of the test (red arrow):
Cardiac MRI scan
Rationale:
Given the left ventricular hypertrophy seen on echocardiography, Adam is booked in for a cardiac MRI scan.
The advantages of a cardiac MRI over echocardiography are that MRI provides clearer and more detailed images of cardiac structure and is gold standard for measurement of chamber size (volumes) and function (ejection fraction). It can also evaluate segments of the left ventricle which may not be clear or are missed on echocardiography such as the apex; it therefore helps provide more accurate assessment of cardiac structure and any left ventricular hypertrophy present. However, one of the biggest advantages of cardiac MRI over echocardiography is the ability to perform tissue characterisation through the administration of gadolinium contrast agent. Gadolinium accumulates in areas of scar and fibrosis in the myocardium so images taken at a particular time following gadolinium administration (“late gadolinium” imaging) can highlight scar or fibrosis (“late gadolinium enhancement”) which appear brighter/white compared to the surrounding normal myocardium.
Results & Explanation
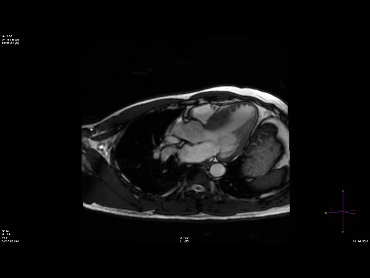
Adam’s cardiac MRI demonstrates the following:
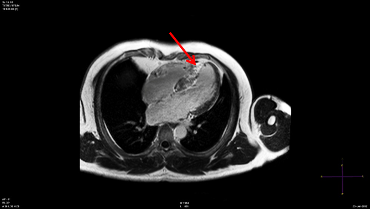
1. Asymmetric septal hypertrophy, in keeping with the echocardiogram findings (there is no LVH seen elsewhere):
2. Late gadolinium enhancement indicative of fibrosis in the septum: